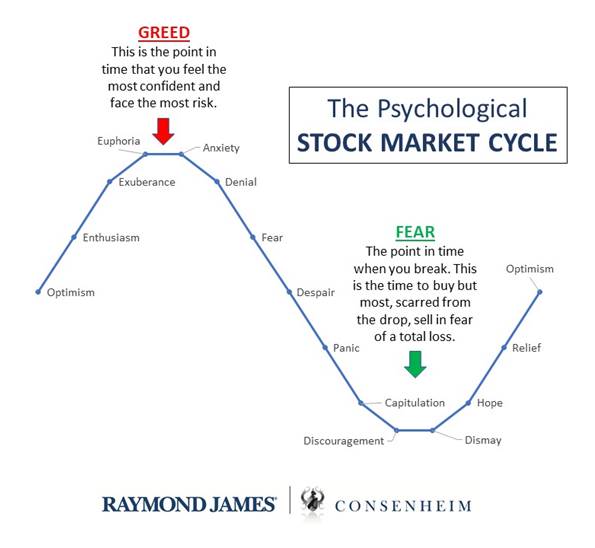
The Psychological Stock Market Cycle
If you were to look in the mirror, and be honest, where do you feel you are?

If I was to look in the mirror, I would have a hard time figuring out where we are in the cycle. My best guess would be somewhere between exuberance and anxiety. Expanding on this further I would say we are at different points depending on the underlying investment. Maybe something like this:
- Growth – Anywhere between anxiety and despair
- Crypto - Anywhere between anxiety and fear (probably some “buy the dip” mentality)
- Value – Between enthusiasm and exuberance
The reality is that we really don’t know and the nice rolling curve above never works out quite like that. We could be in one part or another for prolonged periods. We could bounce back and forth between stages and the whole thing could fall apart due to some extraneous event.
I will say we are erring on the more defensive side currently. We are reviewing all our portfolios and ensuring that they are allocated appropriately. Some of the metrics we are making sure to align are:
- Shorter duration, more diversified fixed income (bonds…)
- Value over growth
- Balanced over straight equity
- Real estate and mortgage exposure
- Private exposure
This is definitely a time to know what you own and why you own it. It is also not a bad time to have some cash for a few reasons. Firstly, if the market drops and you need funds and secondly if the market drops and there are buying opportunities.
Just be patient, make a reasonable return and buy when the markets are really down. I am not sure if this current market (last 10 plus years) has really educated investors with its true behaviour.
Buy the dip once and you feel OK, buy it again (further down) and you get a little nervous but that third dip might just break your market tolerance. The tech wreck (Aug 2000 – Sep 2002) took over two years to go from top to bottom and the great financial crisis (Oct 2007 – Mar 2009) around 18 months. The one-month COVID crash in 2020 was not the normal time frame.
Les Consenheim is a portfolio manager with Raymond James Ltd -Consenheim Wealth Management and can be reached at (250) 372-8117 or les.consenheim@raymondjames.ca Raymond James Ltd. is a member CIPF.
This newsletter has been prepared by Raymond James Ltd. (“RJL”). It expresses the opinions of the writer, and not necessarily those of RJL. Statistics, factual data and other information are from sources believed to be reliable but accuracy cannot be guaranteed. It is furnished on the basis and understanding that RJL is to be under no liability whatsoever in respect thereof. It is for information purposes only and is not to be construed as an offer or solicitation for the sale or purchase of securities. RJL, its officers, directors, employees and their families may from time to time invest in the securities discussed in this newsletter. It is intended for distribution only in those jurisdictions where RJL is registered as a dealer in securities. Distribution or dissemination of this newsletter in any other jurisdiction is strictly prohibited. This newsletter is not intended for nor should it be distributed to any person residing in the USA. Raymond James Limited is a Member Canadian Investor Protection Fund.


